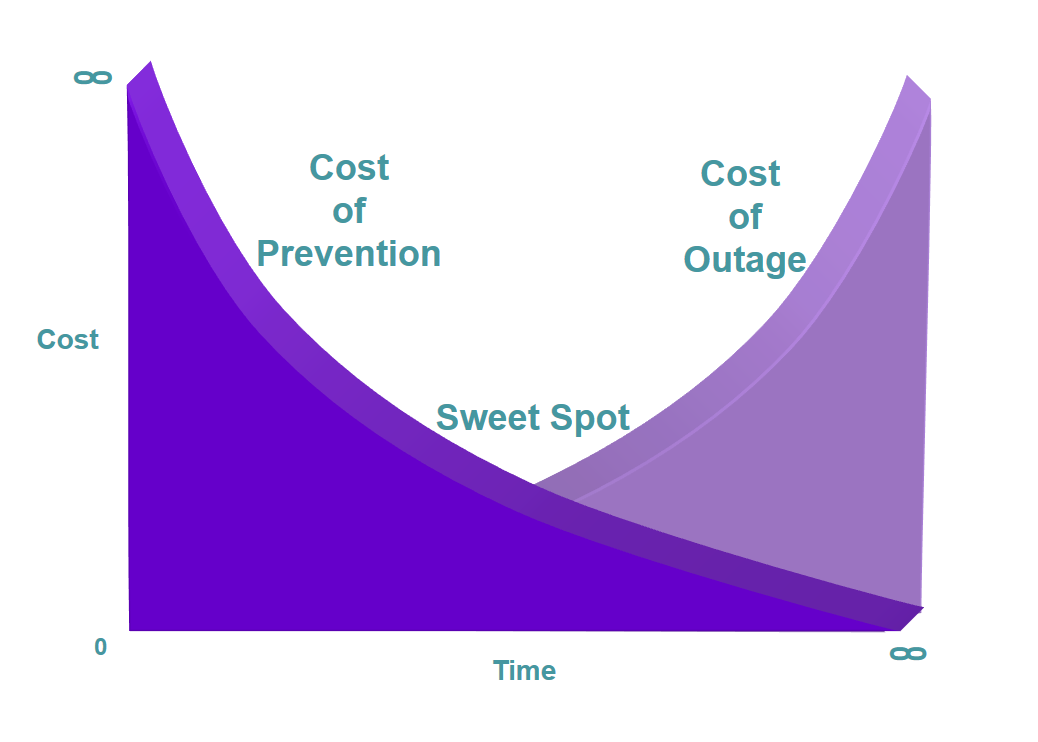
 This flaw manifests in sub-optimal and/or overly expensive recovery architectures. Most BIAs gather information based on the “Sweet Spot” premise. The “Sweet Spot” premise was formulated in the DR/BC industry’s early days and was illustrated as two opposite curves plotted against a vertical axis of solution costs and a horizontal axis of recovery time.
The first curve sloped smoothly from the high left (greater cost for faster recovery) to the low right (lower cost for slower recovery). The second curve rose from the low left (little loss from short outages) to the high right (great cost from long outages).
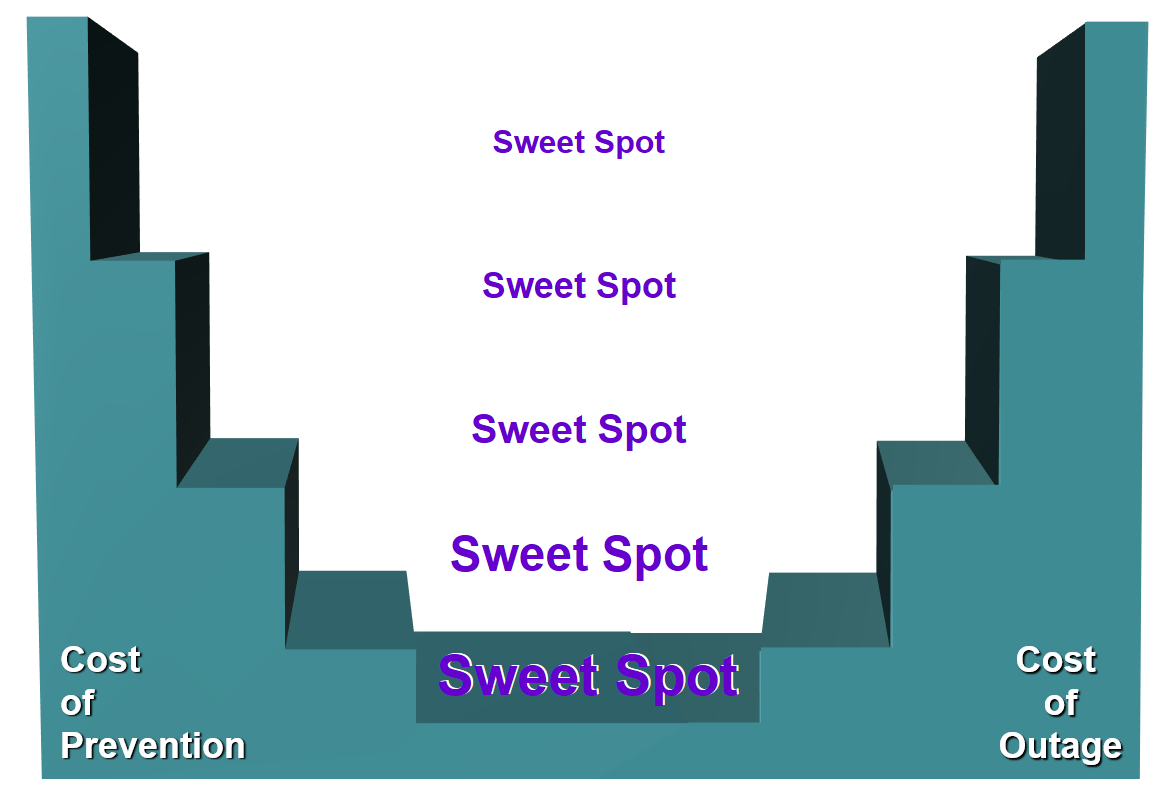
The “Sweet Spot” was where the two curves intersected and was intended to represent the optimal balance of the cost of prevention relative to the cost of outage. At first, this concept appears logical. However, in reality, neither the cost of prevention or the cost of outage are curves at all. They are stair cases and very uneven stair cases at that.
The difference is that in the real world, as you move up the cost scale or along the time scale those moves are not smooth and gradual. They are abrupt and dramatic. For example, going from 3-day recovery to sub 24-hour recovery is not an incremental cost of a few percentage points. It is a significant jump that might represent 3, 4 or 5 times more cost and complexity. Unless the BIA methodology specifically recognizes and gathers this “outlier” data, the warnings necessary for optimal solution modeling will not be available.
For example, there will be no warning that a process should be revisited to determine if its RTO could be delayed 24 hours to reduce costs and/or simplify recovery. Conversely, there will be no warning that a process’ RTO should be shortened to “guarantee” that it is achievable so that the unacceptable losses of a missed RTO are avoided.
It’s time to dump the traditional BIA!
The Wrong Solution Curve
NextGen Reality